 https://earth-investment.com/wp-content/uploads/2024/08/Fly_In_Indonesia_Mine_ERI-1500x1000.jpg
Featured Image: Departure from Grasberg Mine, the largest gold mine in the world (Irian Jaya, Indonesia)
Source: Earth Resource Investments
With the end of the reporting season for Q2 2024, it is worth taking a look at the development of the profitability of gold producers, as precious metal prices experienced one of their best quarters in history given the soaring gold and silver prices (average increases of +13% to US$2,339 and +24% to US$28.9 per ounce from Q1 to Q2 2024, respectively). Gold ended the quarter at $2,327 per ounce, silver at $29.1 per ounce. The tailwinds for gold and silver have been manifold, including central bank purchases, expectations of interest rate cuts and increased technical applications (silver in solar cells).[1] Investors’ focus remains on other equity sectors (e.g. IT, AI), but we see the beginning of a trend reversal in view of the increasingly attractive valuations of precious metal stocks.
Fig 1: Gold and silver prices showed record-breaking increases in the second quarter of 2024 compared to the previous quarter
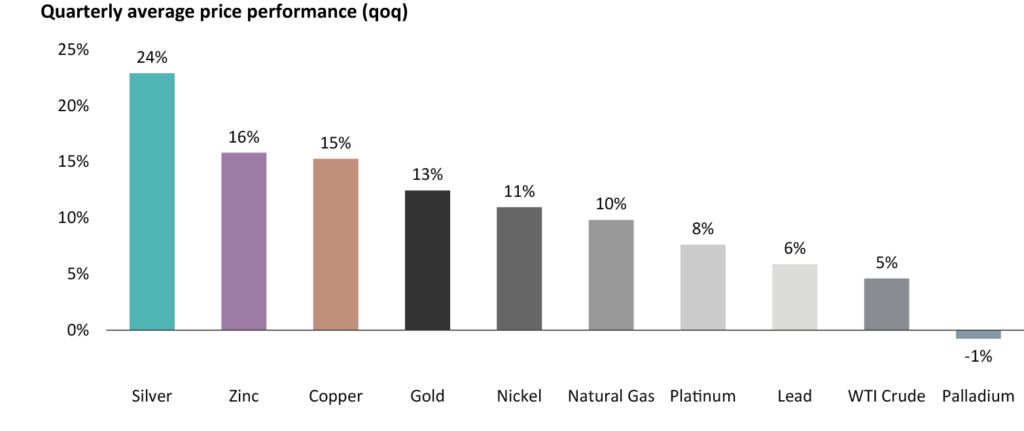
Source: CapIQ, Earth Resource Investments
With the help of our internal database, we analyze the cost development of the gold industry since the year 2000. The analysis includes the 10 largest gold producers and captures the profitability of the gold industry relative to the development of the gold price (yellow line in Fig. 2). For Q2 2024, average all-in costs were $1,809 per ounce, or an increase of 3% relative to the previous quarter. The increase is mainly due to a seasonally weak production quarter.
Fig. 2: Development of the average all-in costs (AIC) for the 10 largest gold producers
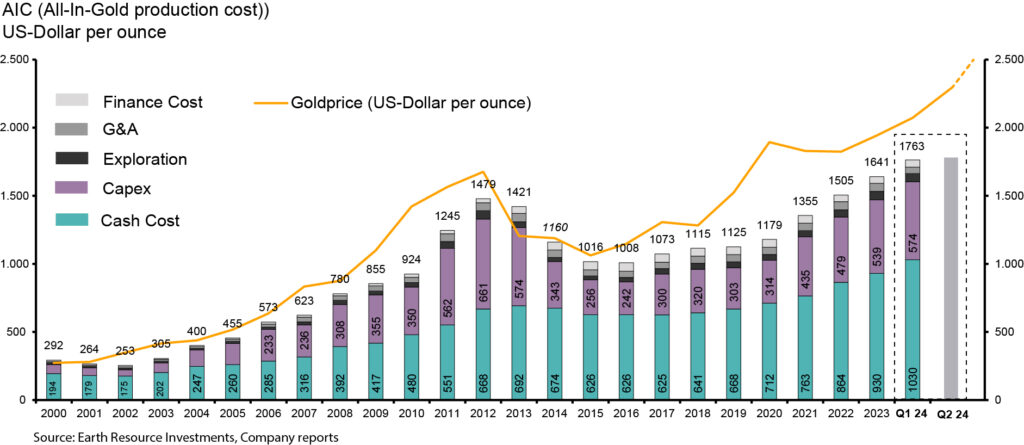
Source: Earth Resource Investments
It is important to emphasize that the 3% increase in AIC compared to the 13% increase in the price of gold quarter-on-quarter leads to significant margin expansion (Fig. 3). Looking ahead, there are many indications of cost discipline on the part of producers, as the majority of companies have maintained their production and cost forecasts for the second half of the year or even increased their production levels, which means that total costs could trend downwards over the course of the year. If the price of gold continues to rise, this could lead to a record-high margin expansion: at the time of writing this report, the price of gold was $2,510 per ounce! In our opinion, such a positive development of the gold sector can hardly be ignored by the market; we expect a rerating.
Fig. 3: The 3% increase in gold producers’ AIC (All in Costs) was far outweighed by the 13% increase in the price of gold in Q2 2024. With further margin expansion, we expect a rerating of the sector.
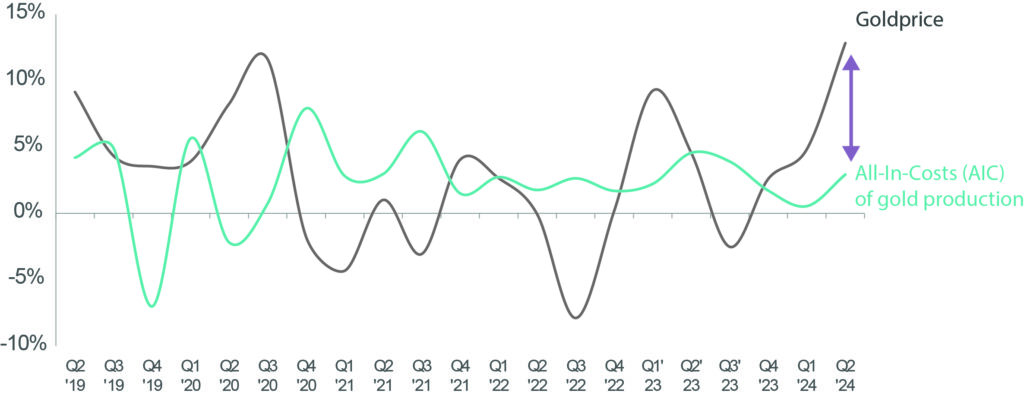
Source: Earth Resource Investments, Company Reports
When the price of gold rises, the leverage of gold stocks becomes apparent
Looking at it in more detail, the 10 largest gold producers we monitored (excluding Goldfields and Harmony, for which no quarterly figures were available at the time of writing) generated free cash flow of $1.996 billion in Q2 2024 (Fig. 4). In comparison, free cash flow in Q2 2023 was just $0.378 billion, about a 4.3x increase (Fig. 4). The average gold price increased by 18% on a quarterly basis (from US dollars 1,976 to US dollars 2,339 (Fig. 4)). In the expectation of an average increase in production in the second half of 2024, a further acceleration in free cash flow is to be expected – a rerating of gold stocks is becoming increasingly likely.
Fig. 4 Gold producers recorded a more than 4-fold increase in free cash flow in Q2 2024 compared to the same quarter in 2023. At the same time, the price of gold rose by only 18%.
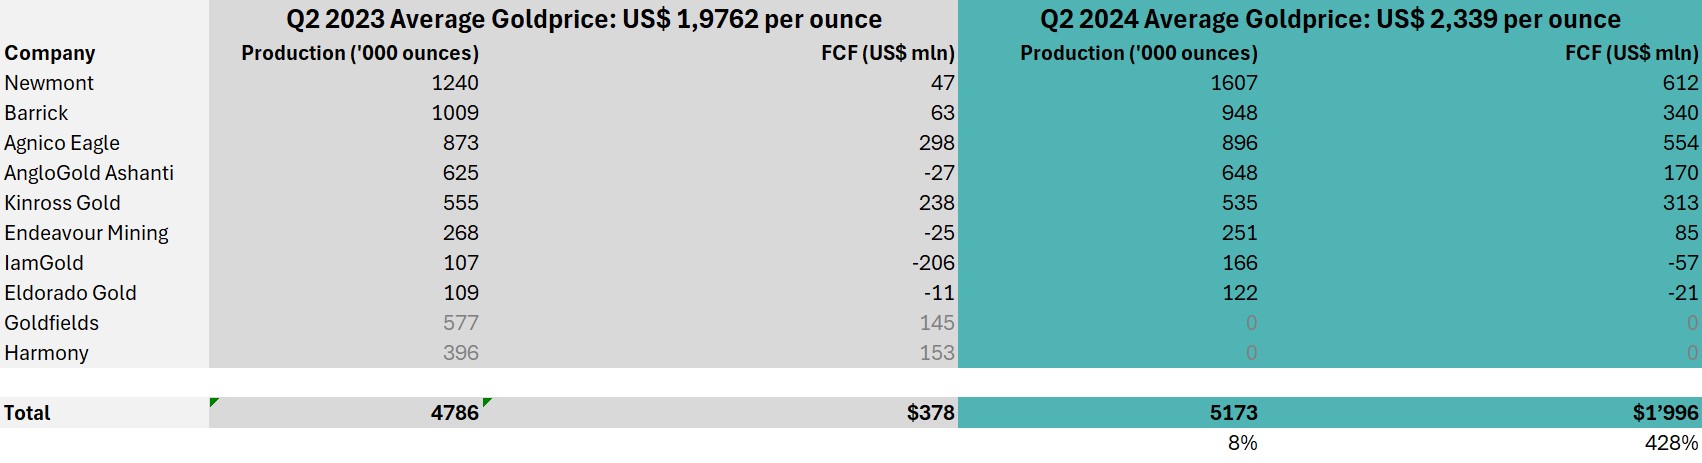
Source: Earth Resource Investments, Company Reports
Now the question arises as to what the gold sector will do with the rising free cash flows. The last few years have been very frustrating for gold investors: there has been a lack of a convincing upward movement in the gold price and solid results from producers and explorers have received little attention. Despite a gold price at record highs and rising free cash flow margins, gold stocks are still receiving little attention, but this could now change: with the sector’s net debt/EBITDA[2] expected to be as low as 0.2 times by the end of 2024[3]. Corporate balance sheets are becoming increasingly robust and debts are being reduced at an accelerated pace. But there could be other attractive developments for investors: share buybacks (due to the low share valuation) and dividend yields that could rise above the current average of 3% make the sector increasingly attractive.
All this hints to fair prudence which is welcome given the missteps of the last cycle, however we remain confident that the status quo will not hold. With both gold price and producer’s margins record high, it is only a matter of time before the wider market catches up with the sectors solid fundamentals. As such, a strong gold equity rerate is likely imminent.
[1] See detailed discussions in the Q2 quarterly reports on the Earth Gold Fund UI and Earth Exploration Fund UI
[2] EBITDA = Earnings before interest, tax, depreciation & amortisation (i.e. operative cashflow)
[3] Precious Metals: 2Q24 Earnings Preview; July 10th 2024; RBC Capital Markets

