 https://earth-investment.com/wp-content/uploads/2024/09/IMG_8558.jpeg
By Willem de Meyer, Consultant to ERI AG
Looking at the evolution of the oil and gas industry over the last two decades, it can be divided into four periods separated by events that led to dramatic corrections in oil prices. These are shown in the following diagram on top of the “Brent” oil price (Fig. 1). Also shown are the aggregate market capitalization of the current top ten positions of the Energy Select Sector SPDR Fund (“XLE”) as an indicator of the development of the major producers and service companies in the oil industry, as well as the aggregate market capitalization of the oil and gas companies that are currently held in the Earth Exploration Fund UI. For the latter, only periods 3 and 4 are relevant, as some of the invested companies did not previously exist or were not listed on the stock exchange.
Fig. 1: Development of the oil price (Brent); in US dollars per barrel, left axis), market capitalizations of the Energy Select Sector SPDR Fund (“XLE”; the top ten positions are considered; market capitalization/50 for better presentation) and the companies invested in the Earth Exploration Fund UI. Four periods of oil price development can be seen, which are separated by strong corrections in oil prices (see text for discussion). What is striking is the increase in stock prices in the current (fourth) period, despite falling oil prices.
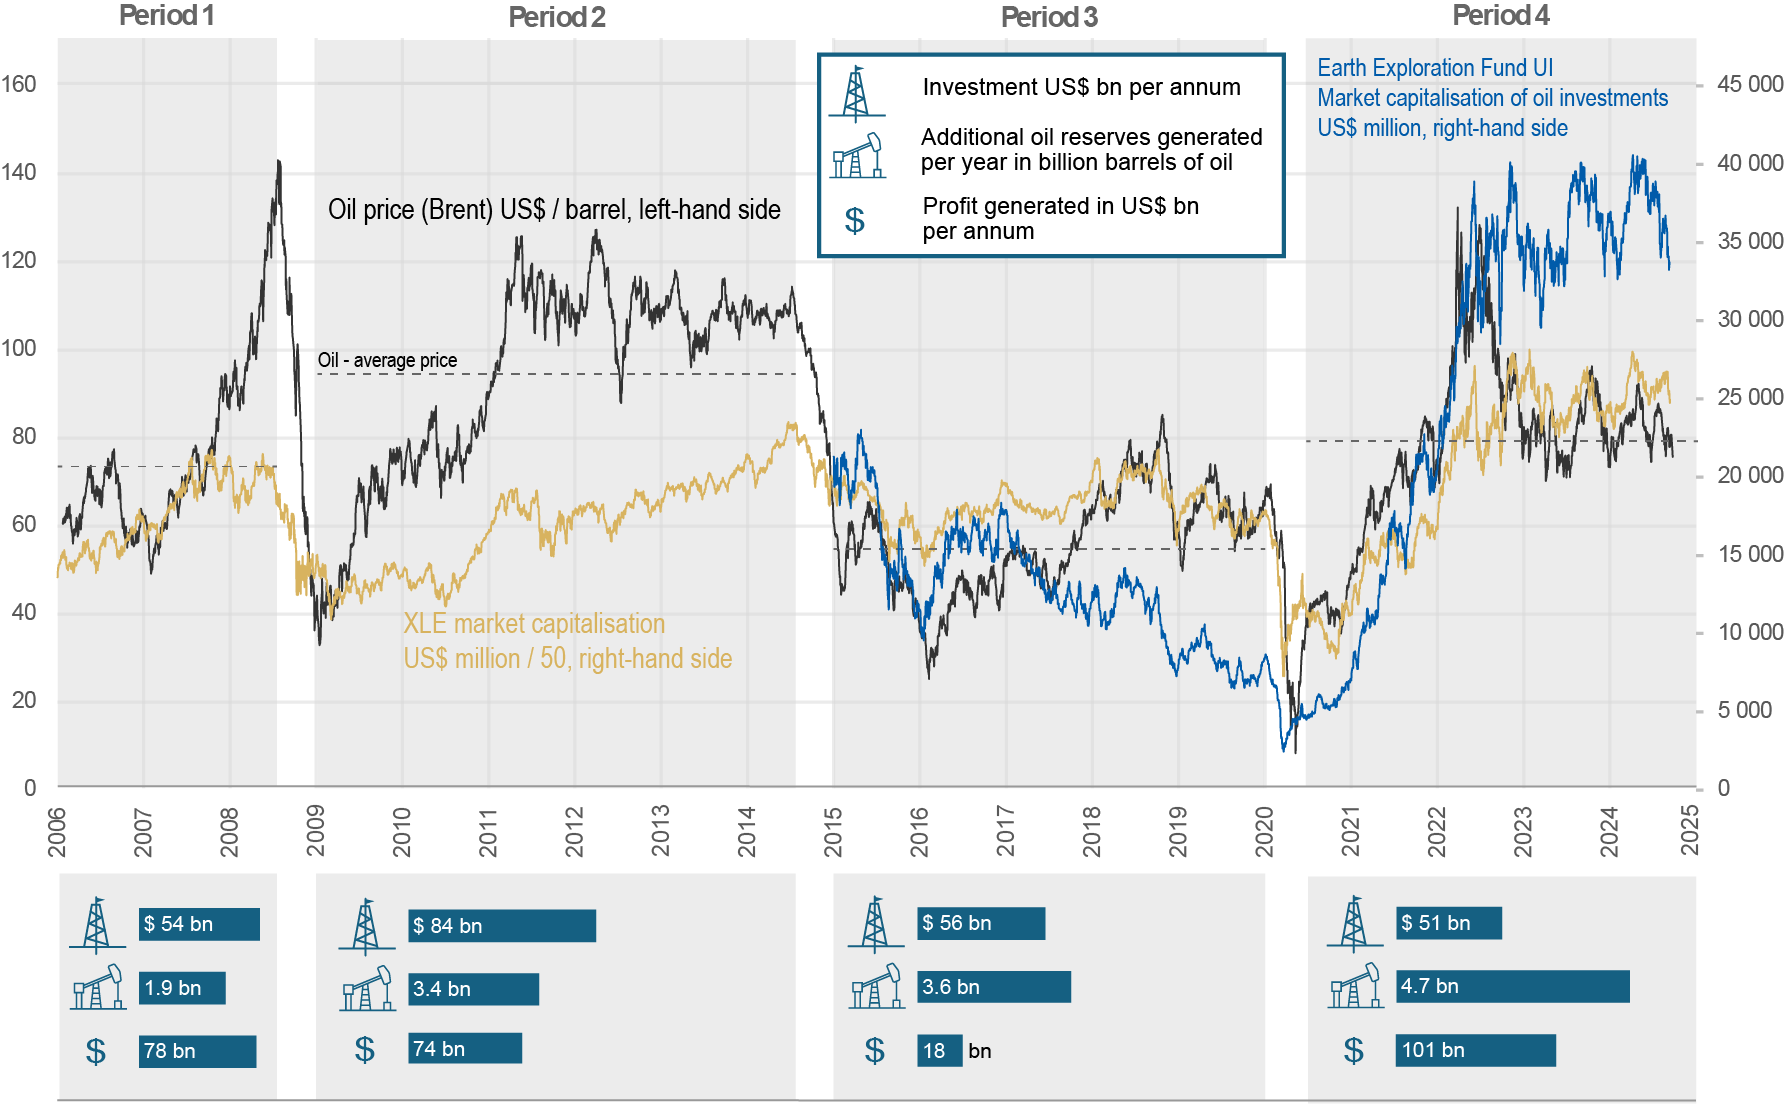
Source: Rystad Energy, ERI, CapIQ
2006 – 2008: rising oil prices, healthy margins
The first period, from 2006 to 2008, was characterized by an increase in the price of oil (Brent) from US$60/bbl to US$140/bbl before plummeting to below $40/bbl in the Global Financial Crisis (“GFC”); on average, the Brent price was US$74/bbl. Investors invested heavily in oil stocks during this period, as shown by the rise in XLE market cap. On the other hand, oil producers invested in exploration and production growth. The average annual total exploration and development (“E&D”) investment of the top ten producers in the XLE was US$54 billion, resulting in an average annual addition of 1.9 billion boe in reserves; the companies generated an average income of US$78 billion per year.
2009 – 2014: The era of the fracking industry; falling profitability, crashing stocks
Oil prices recovered quickly after the 2008 crash and stabilized, although they did not reached the peak of early 2008. It stabilised at a relatively high level of around US$110/bbl for several years. This period coincided with the rapid expansion of fracking technology in North America. The success of the widely deployed new technology ultimately resulted in an oversupply of oil and gas, causing oil prices to decline over an 18-month period to US$30/bbl at the beginning of 2016. The XLE Group’s total annual investment in exploration and development increased rapidly (to US$84 billion); reserves increased by a total of 3.4 billion boe. However, the average profit of this group of companies fell as the companies largely reinvested their cash flow in exploration, development and new technologies. Shale-focused companies in particular aggressively pursued production growth, spending even more than they generated in cash flow, funded by increasing debt and issuing of new shares. The companies’ share prices initially continued to rise as the price of oil stabilized from 2011 to mid-2014, as investors initially got carried away by the growth euphoria and the new fracking technology. However, the resulting extreme overvaluations in the face of negative cash flows were no longer sustainable and share prices collapsed at the end of this period as investors fled the sector.
2015 – 2019: Portfolio optimization
After the collapse in stock prices, the industry “licked its wounds” and the third period developed into a period of portfolio optimization, cost reduction and lower margins for the oil industry. Shale producers realized that the focus on production growth at the expense of shareholder returns was unsustainable, and their capital allocation strategies shifted toward investing within cash flow and focusing on “shareholder value.” As a result, balance sheets were repaired, debts were reduced and returns to shareholders increased.
Oil prices slowly recovered to US$80/bbl as supply rebalanced with increasing demand. The XLE Group’s average annual E&D capital expenditure fell to US$56 billion during the period, while annual average added reserves increased slightly to 3.6 billion boe. This indicated increased efficiency, lower costs and portfolio optimization. The group’s average annual total income fell significantly to US$18 billion, which coincided with the decline in oil prices compared to the previous period. The average top ten market capitalization of the XLE group decreased to 15% below the peak of 2014, but the market capitalization of the oil and gas companies held by the Earth Exploration Fund UI during this period went into a significant downward trend, reflecting a risk-averse attitude toward smaller companies after the boom years of the second period. This period of consolidation ended abruptly with the outbreak of the Covid19 pandemic in early 2020, which led to a dramatic collapse in global oil demand and a fall in oil prices to below US$20/bbl.
2020 – 2024: Increase in oil demand, headwinds from the energy transition, capital discipline
The fourth period began in mid-2020, when oil prices initially recovered quickly from the Covid-induced crash, briefly peaking at US$120/bbl before stabilizing in a range around US$80/bbl. At the same time, oil demand increased steadily, which provided support for oil prices. This phase, which we are currently in, is characterized by capital discipline in the industry and a focus on efficiency, sustainability and shareholder returns. Free cash flow generation and dividend yields are currently among the most attractive of all equity sectors (Fig. 2).
Fig. 2: Of all equity sectors, oil stocks are currently the most attractively valued equity sector. Vertical axis: EV/EBITDA ; horizontal axis: Free Cash Flow Yield (%). Despite falling oil prices, the attractive dividend yields continue to attract investors.
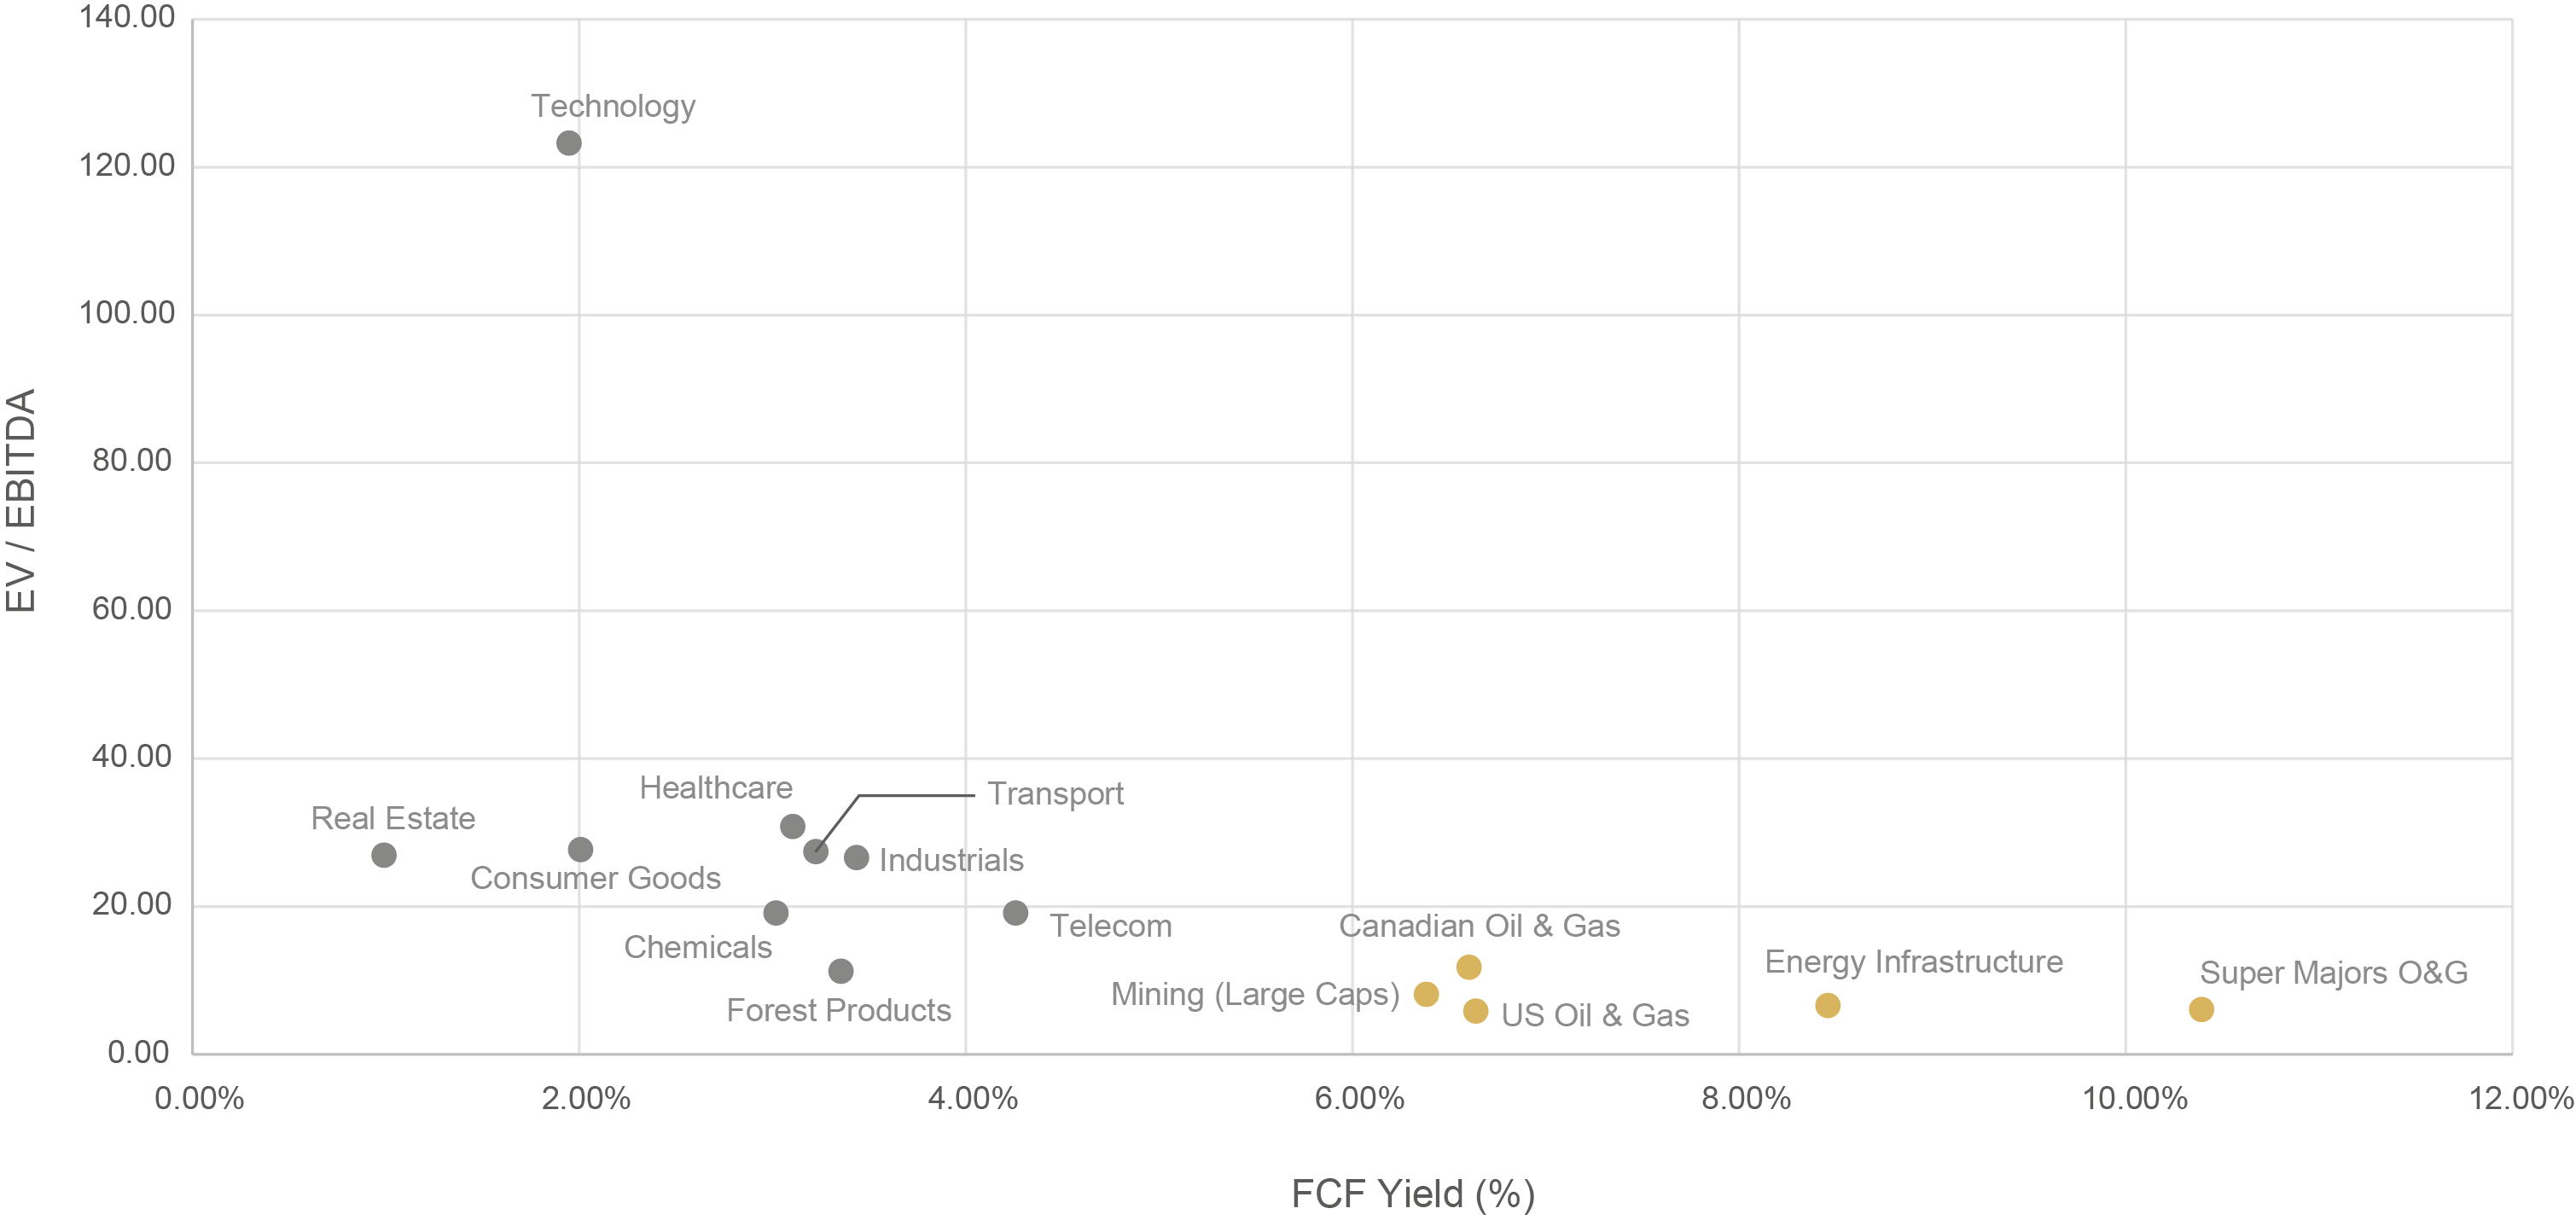
Source: ERI, CapIQ
The industry’s more cautious stance is also a response to the expected reduction in oil demand and pressure from energy transition advocates to reduce the use of oil and other fossil fuels (exit from fossil fuels; “Net Zero 2050”). The average annual E&D investment of the analyzed XLE firms fell further to US$51 billion during this period, reflecting the industry’s cautious stance. What is interesting is that despite lower annual investments, average annual reserves have increased by 4.7 billion boe, reflecting continued efficiency improvements and portfolio optimization – including in the fracking industry. The group’s average total revenue increased significantly to US$101 billion per year. This makes the current period the most profitable period for the industry in the last two decades. Investor confidence in the industry also recovered and the market capitalization of XLE’s top ten holdings stabilized at a range just below the 2014 peak over the past 18 months, while the market capitalization of companies held by Earth Exploration Fund UI continued to rise as investors reward these companies’ new capital discipline and focus on shareholder returns despite efforts to “exit” fossil fuels.
The extent to which this transision will be achievable remains to be seen: in 2024, global oil demand is expected to reach a new all-time high of around 104 million bbl per day (Fig. 3). Looking ahead, the industry faces a number of challenges, including concerns about global growth and the desire to reduce demand for fossil fuels. Nonetheless, the oil sector is in a very healthy state, with strong balance sheets and capital discipline. Given the increasing global demand for oil and energy, oil stocks should therefore be able to withstand these headwinds and oil stocks should continue to offer attractive investment opportunities.
Figure 3: Oil demand continues to increase, averaging about 1 million bbl/day each year. In 2024 it is expected to reach a new all-time high of around 104 million bbl per day.
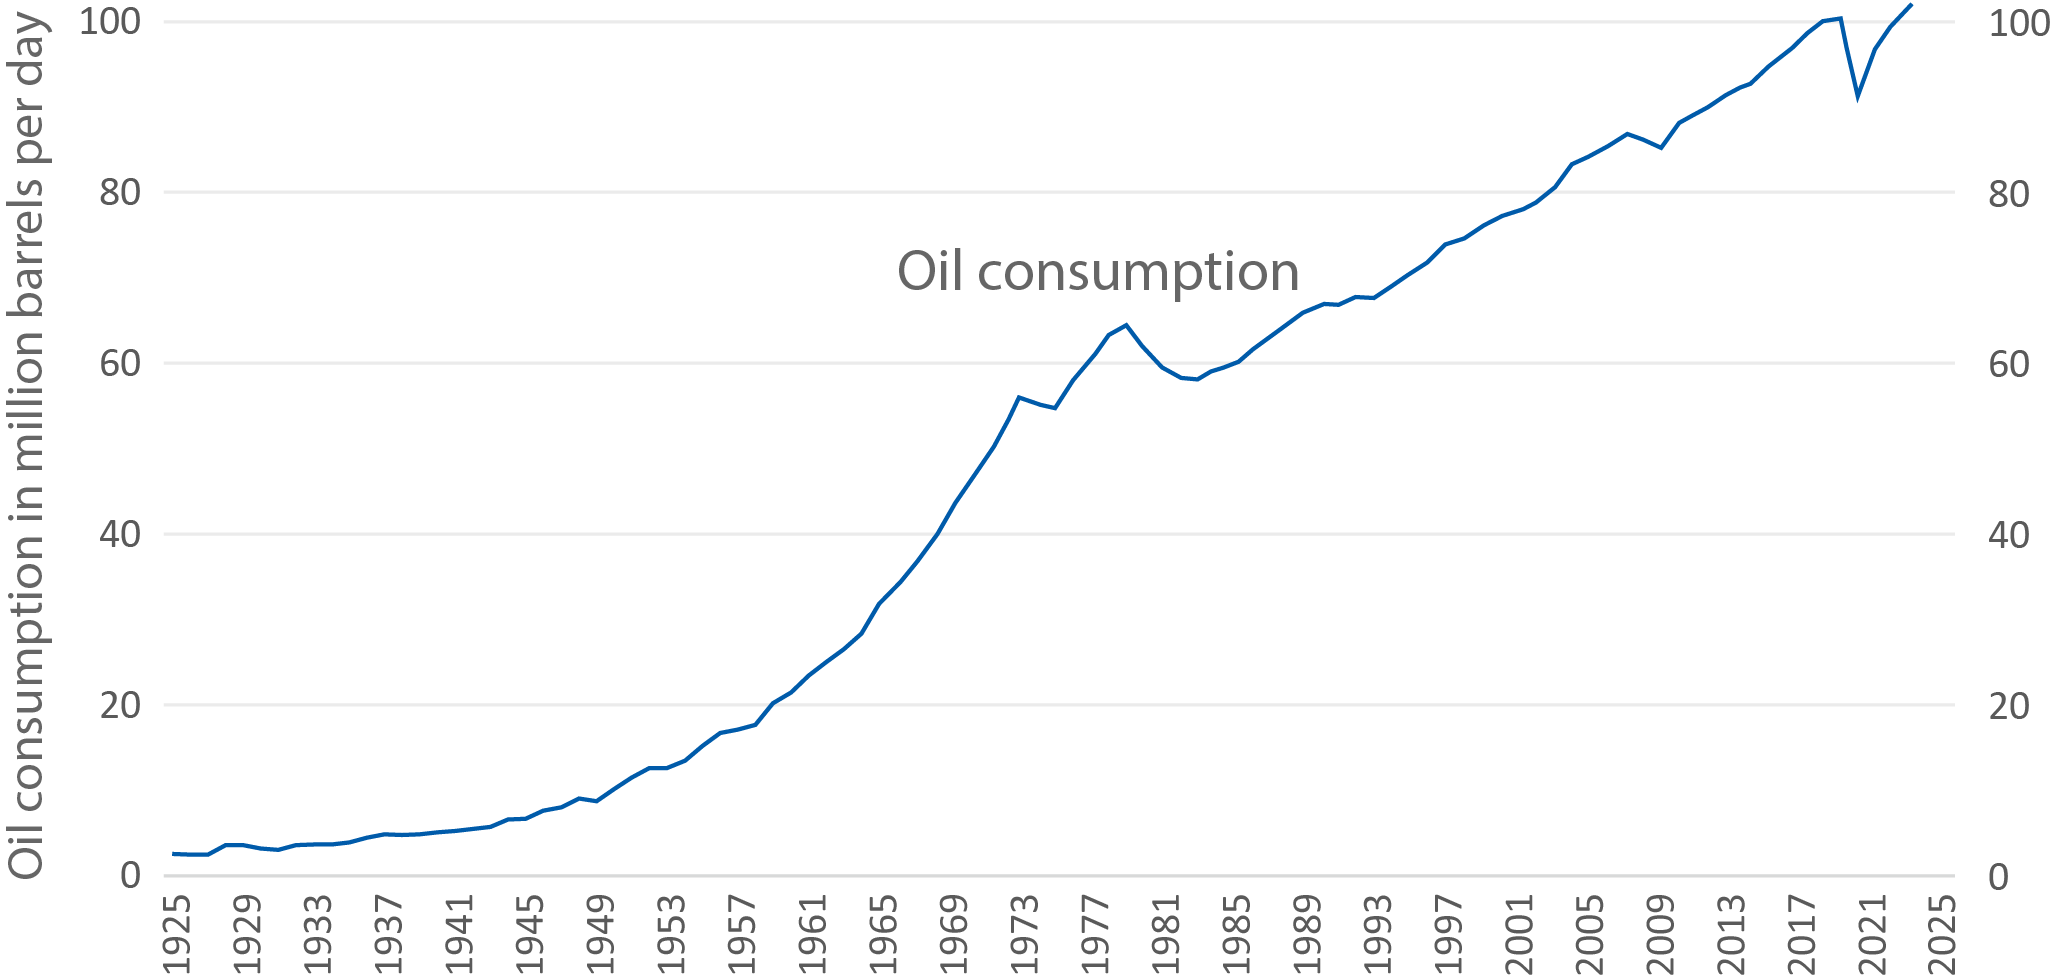
Source: ERI, IEA, ICGS

