For oil it‘s the OPEC as a heavyweight in global oil supply, for copper it‘s Chile and Peru that dominate the supply side for this critical metal for many of the emerging technologies used to achieve the planned energy transition. Both commodities also share the dependency on large, aging deposits that host a very large amount of global reserves (see also „Is copper, the new oil?“). The lack of capital spending over the last decade to develop new fields and deposits is another shared attribute. The world relies on these two commodities more than ever and it‘s therefore even more surprising that so little capital is invested to keep the world well supplied in the future.
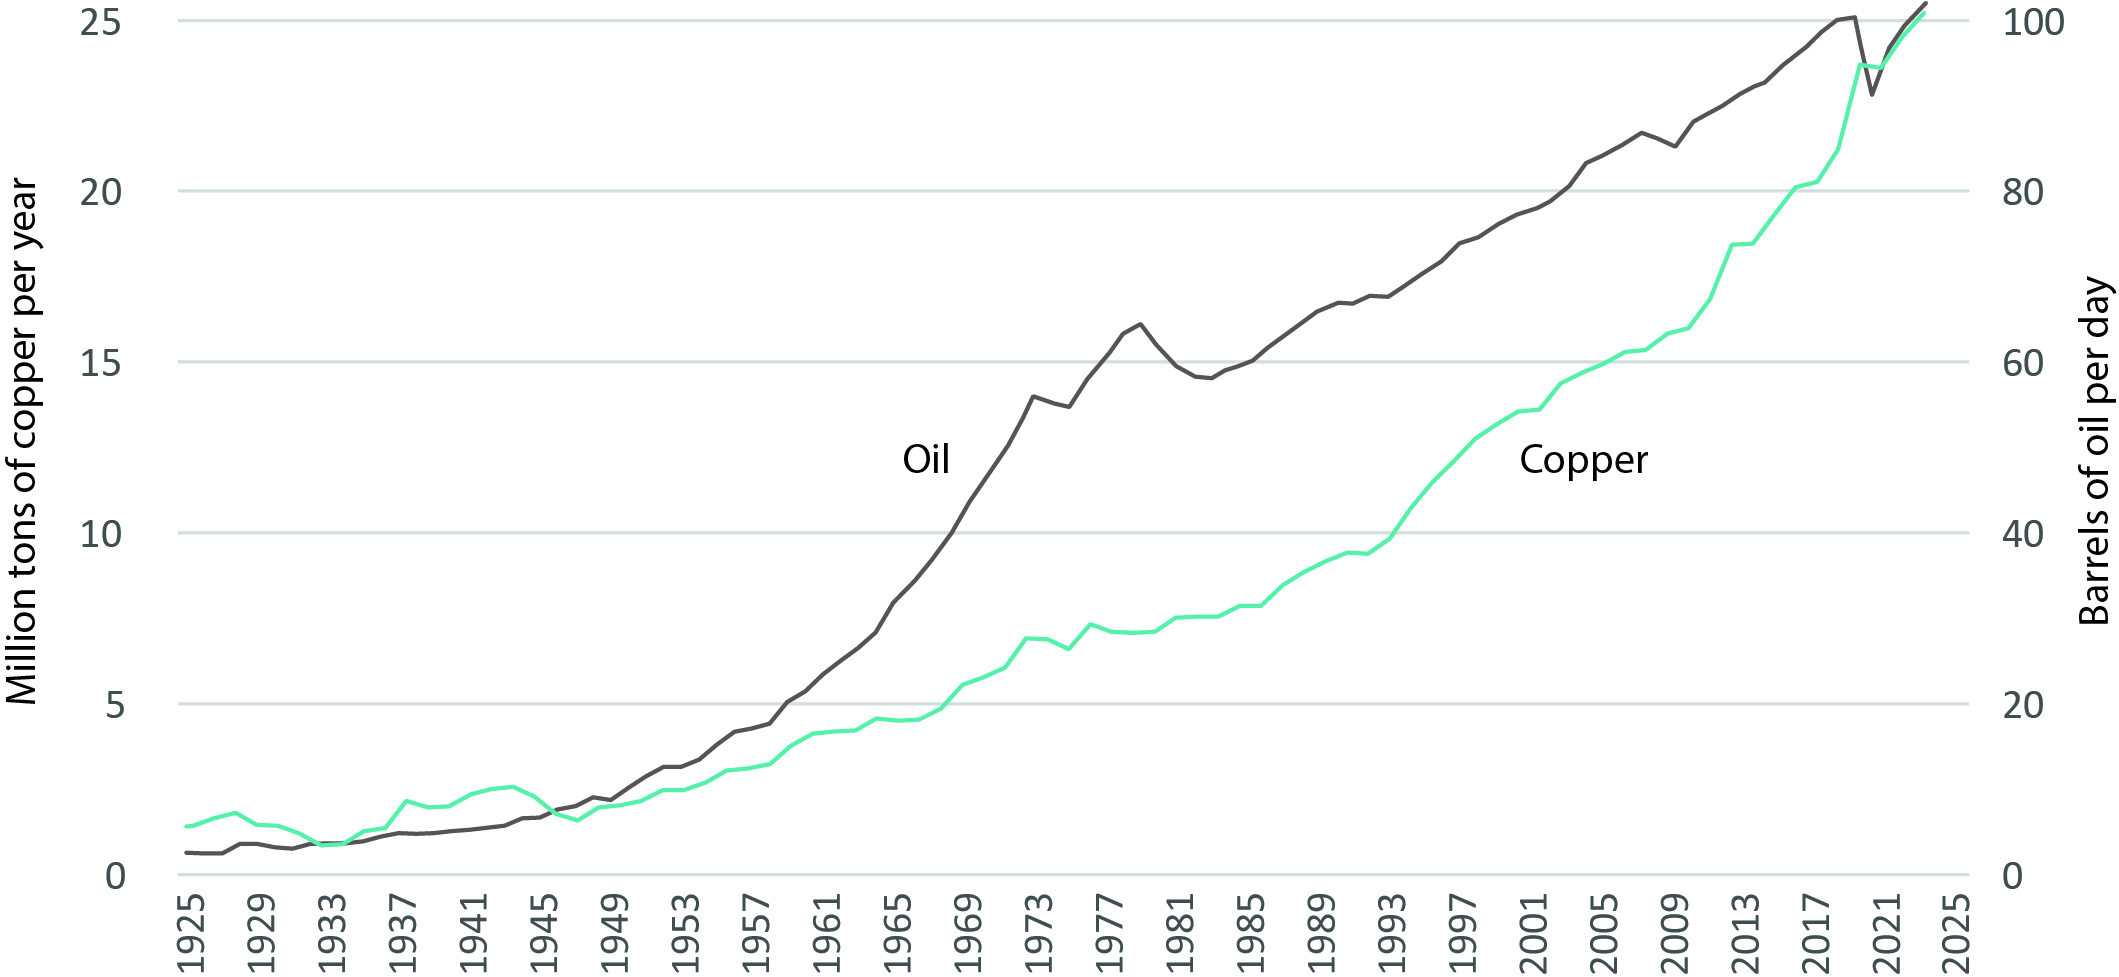
Global crude oil and copper demand since 1925
Source: ERI, BP Statistical Review 2022, EIA, GCSG, JeGross
Oil
Demand
The IEA yet again upgraded 2023 oil demand growth to 2.2million barrels of oil per day (bopd), as non-OECD demand continues to surge. The growth is driven mainly by China where consumption in March broke to the highest ever level of 16.0m bopd. Most of the 2023 growth is projected to happen in the second half of 2023. OECD demand in the first quarter 2023 contracted by 0.3m bopd, but non-OECD oil demand surged by 1.4m bopd, a second consecutive quarterly contraction. The surge in non-OECD demand is hence expected to accelerate in the second half of 2023.
Supply
On the other hand, the global supply growth in 2023 is projected to slow to 1.2mn bopd with the US and Brazil dominating the expansion, falling well short of the projected surge in demand. Gone are the days of over 1.0m bopd growth from US shale (2023 growth: 0.3m to 0.6m bopd), where growth is slowing down after drilled but uncompleted well inventory (DUC) has been exhausted and questions are rising about the quality of the remaining inventory and well productivity. At the same time, limited oil investments by producers, and focus on return of capital continues to curb US shale growth. There will be new areas of growth in the next years, such as Guyana, but overall supply will still fall short of a surge in emerging market demand growth.
If demand is so strong why are oil prices so low?
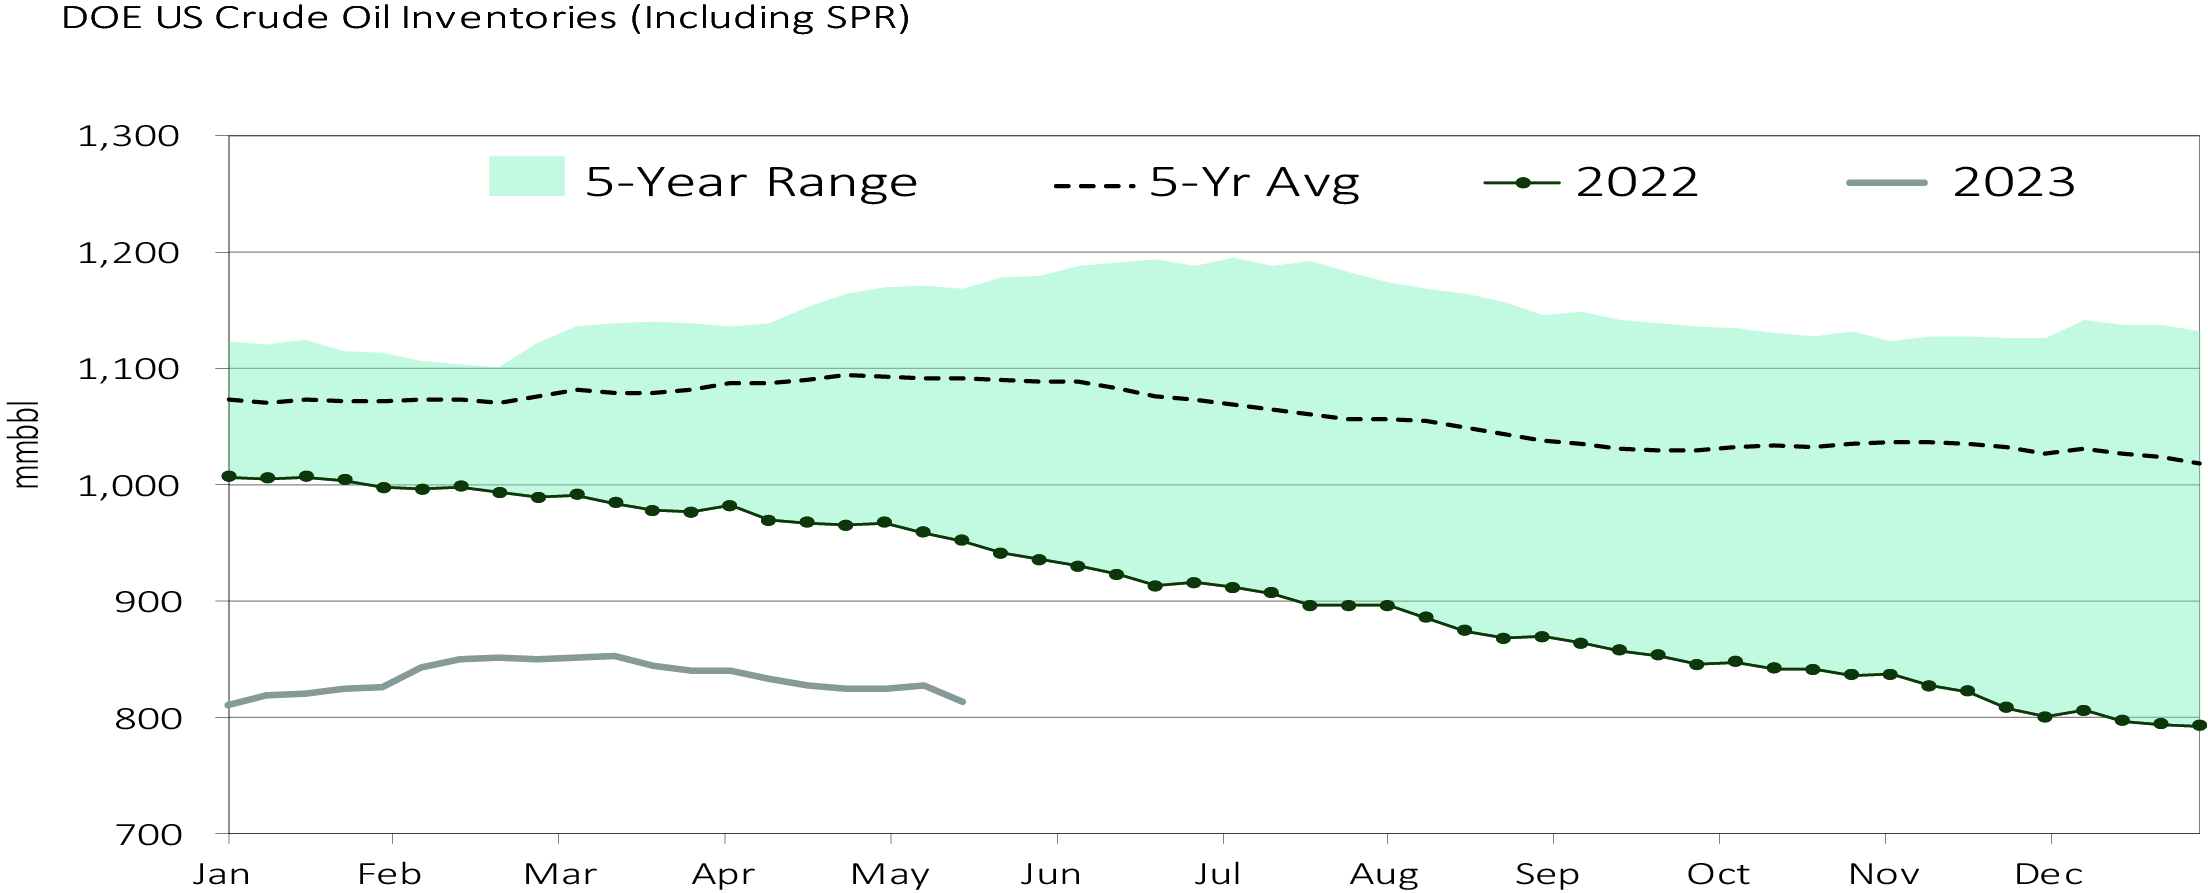
The year to date (per 31.05.2023) Brent oil is down -11.8%, while WTI oil is down -9.5%, which contradicts the robust fundamental oil market and expected shortfall in supply. The reason is an uncertain macro outlook, resilient Russian oil supply, rising exports of Iranian oil as well as higher oil supply from record SPR (Strategic Petroleum Reserves) releases last year.
Oil as an asset class has often been used as a proxy for inflation and recession. Given current recessionary fears and various other market concerns (US debt ceiling, US regional banking crisis, underwhelming Chinese economic recovery) macro funds positioning in oil futures markets is negative and that is keeping oil prices at lower levels.
In fact, the US and the rest of OECD are in a manufacturing recession, but consumer spending and consumer confidence remains strong. Since around two thirds of oil demand is tied to the services sector, the physical oil demand remains relatively high. But it is the negative macro fund positioning in oil futures markets, or anticipatory characteristic of oil as an asset class which is more dominant now.
US crude oil inventories, including strategic reserves (SPR) in million barrels (mmbbl)
Source: Bloomberg, TD Securities, ERI
Copper
Demand
One of the differentiators to oil is the demand side for copper. With over 50% of supplied copper being consumed by China, this demand concentration is much larger for copper as it is for oil. Hence, China is critical for the supply and demand balance for copper. Despite recent news about the slow recovery in China, the copper demand of China isn’t slowing dramatically. The average utilization rate of key copper cathode rod producers increased by 4% to 80%, a very high level, by the end of May 2023 (highest reported in a while). Wire and cable manufacturers reportedly had stable orders, with those from the automotive, energy storage, and wind power sectors improving, but real estate and civil engineering are areas of weakness. Copper concentrate imports into China remain at a very high level and global inventories at copper warehouses are at historic lows.
Supply
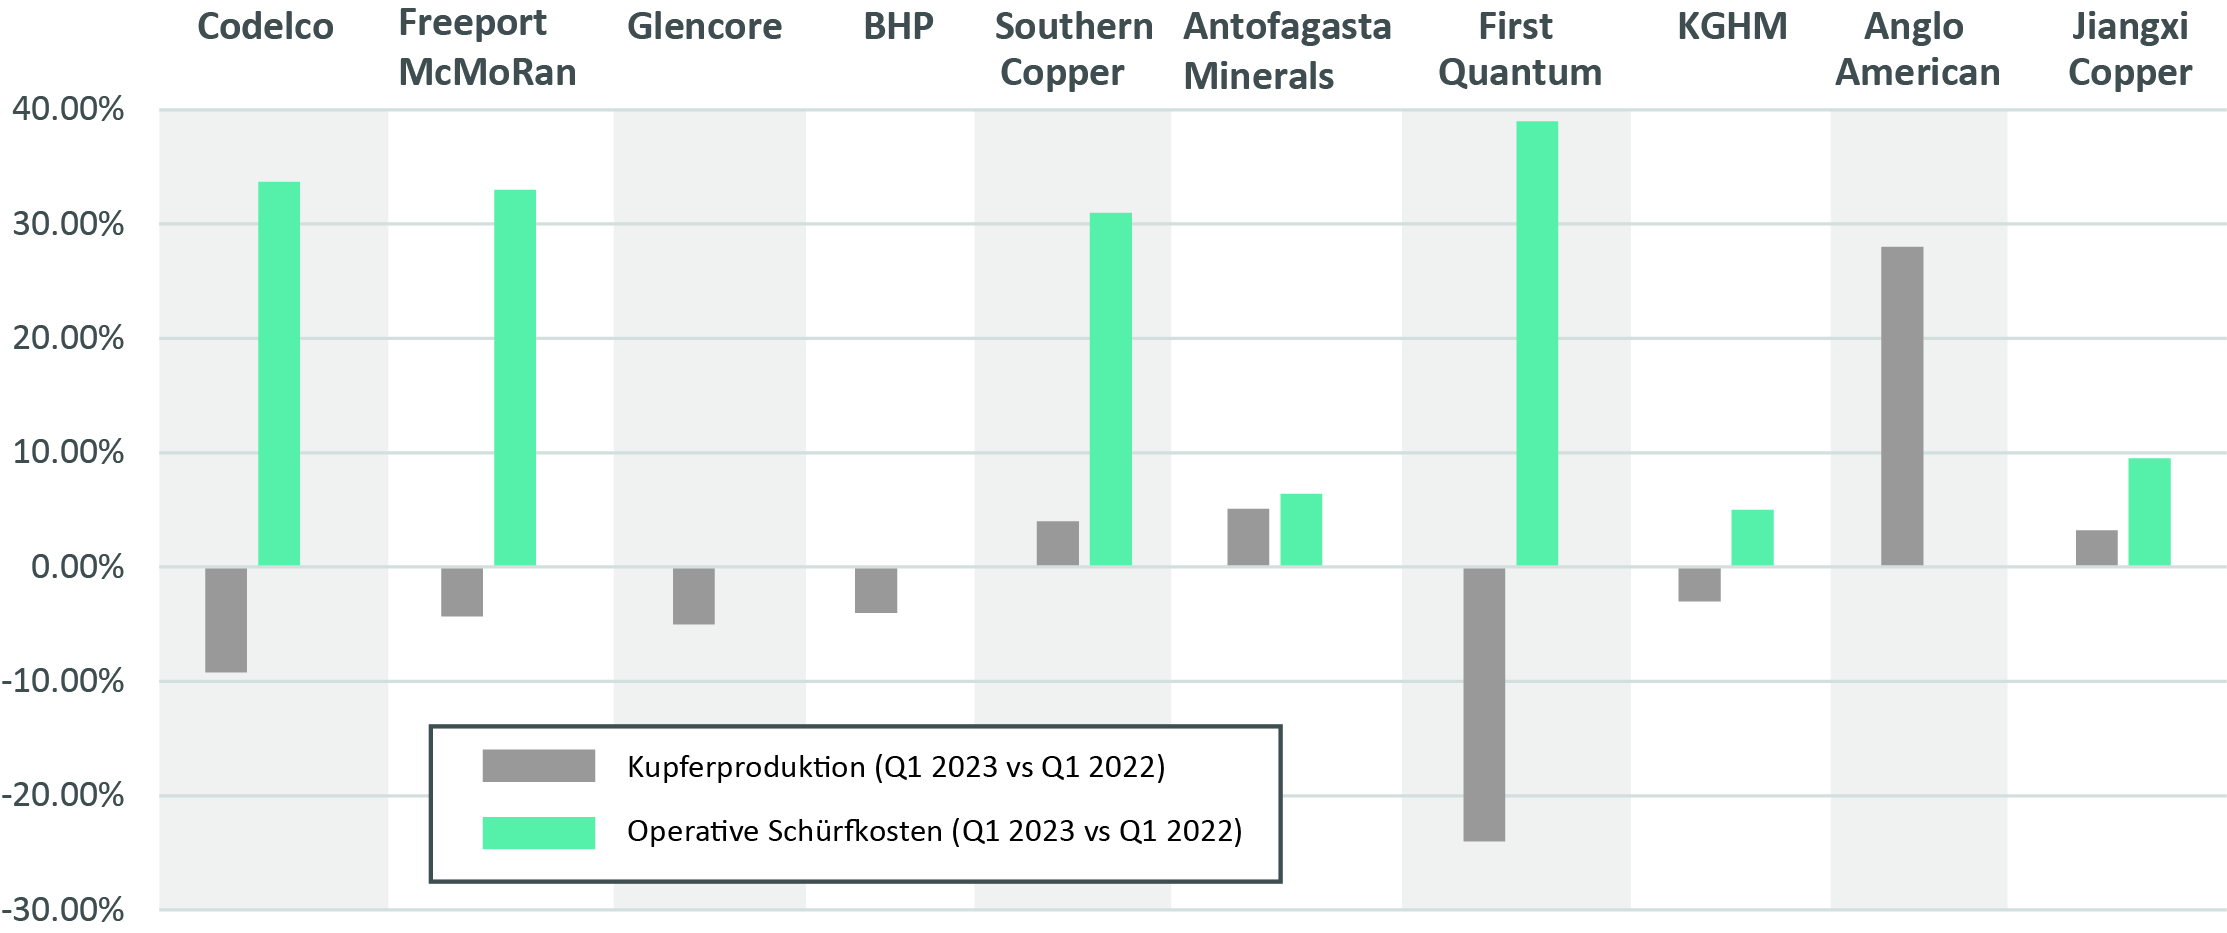
We rate the risks on the supply side far larger than on the demand side as the overall push to electrify mobility and transitioning the primary energy use away from fossil fuels is highly copper intensive. Looking at the world‘s 10 largest copper producers, the stressed supply side becomes clearly visible. Comparing the Q1 2023 copper production with Q1 2022, the decline in production of 6 out of 10 producers is significant and occurred during a time of very good copper prices for these producers. Companies which defied the trend were Anglo American, a company which just commissioned a large copper mine in Peru (Quellaveco) and companies like Southern Copper and Antofagasta Minerals which recovered from a very low base in 2022 with mines located mainly in Chile and Peru. The pronounced increase in operating costs is putting further stress on the supply side. Declining ore grades, a lift in consumable costs, and particularly the rise in labor costs, are the main drivers for the cost inflation for these large copper miners.
Copper production and change in operating costs for the 10 largest copper miners Q1 2023 vs. Q1 2022
Source: ERI, Company reports
Conclusion
In our view, the market is too pessimistic about oil and copper.
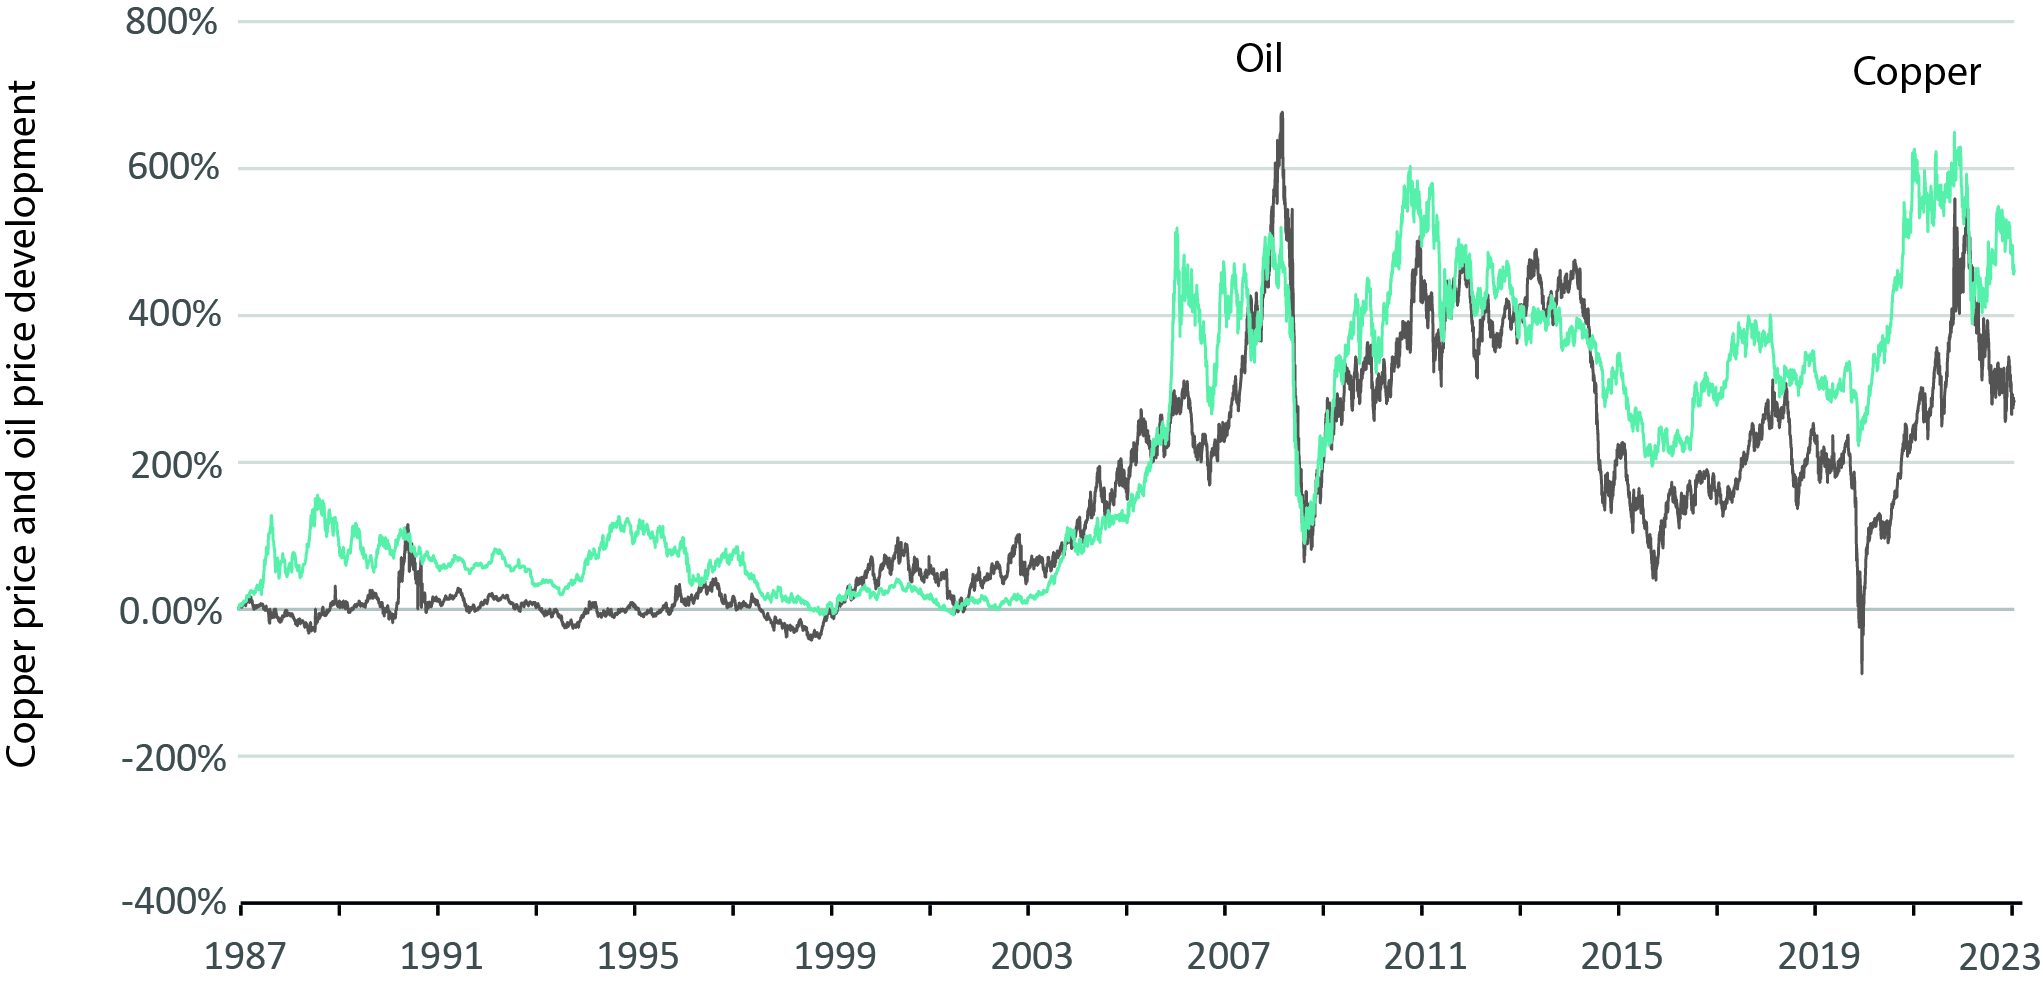
The realised demand and inventory data for oil and copper supports a positive price outlook. We think that the oil deficit, as also projected by the IEA and other agencies, is coming in the second half of 2023. Similarly, the stressed supply side for copper should have prepared the ground for copper prices to increase. The biggest risks clearly are a more severe and prolonged recession but also Russian supply and Russia’s compliance with OPEC+ production cut of 1.0m bopd effective from the beginning of May. Looking at the price development for both oil and copper, the strong link of the two commodities is evident. We expect the large price spread which started to emerge during 2022 and 2023 to close further.
Price development of oil (WTI) and copper since 1987
This website uses cookies so that we can provide you with the best user experience possible. Cookie information is stored in your browser and performs functions such as recognising you when you return to our website and helping our team to understand which sections of the website you find most interesting and useful.
Strictly Necessary Cookie should be enabled at all times so that we can save your preferences for cookie settings.
If you disable this cookie, we will not be able to save your preferences. This means that every time you visit this website you will need to enable or disable cookies again.