As advisors to the Earth Funds, we closely monitor the cost evolution of the largest global gold producers since the year 2000 on a quarterly basis. These companies represent around 40% of overall global gold production.
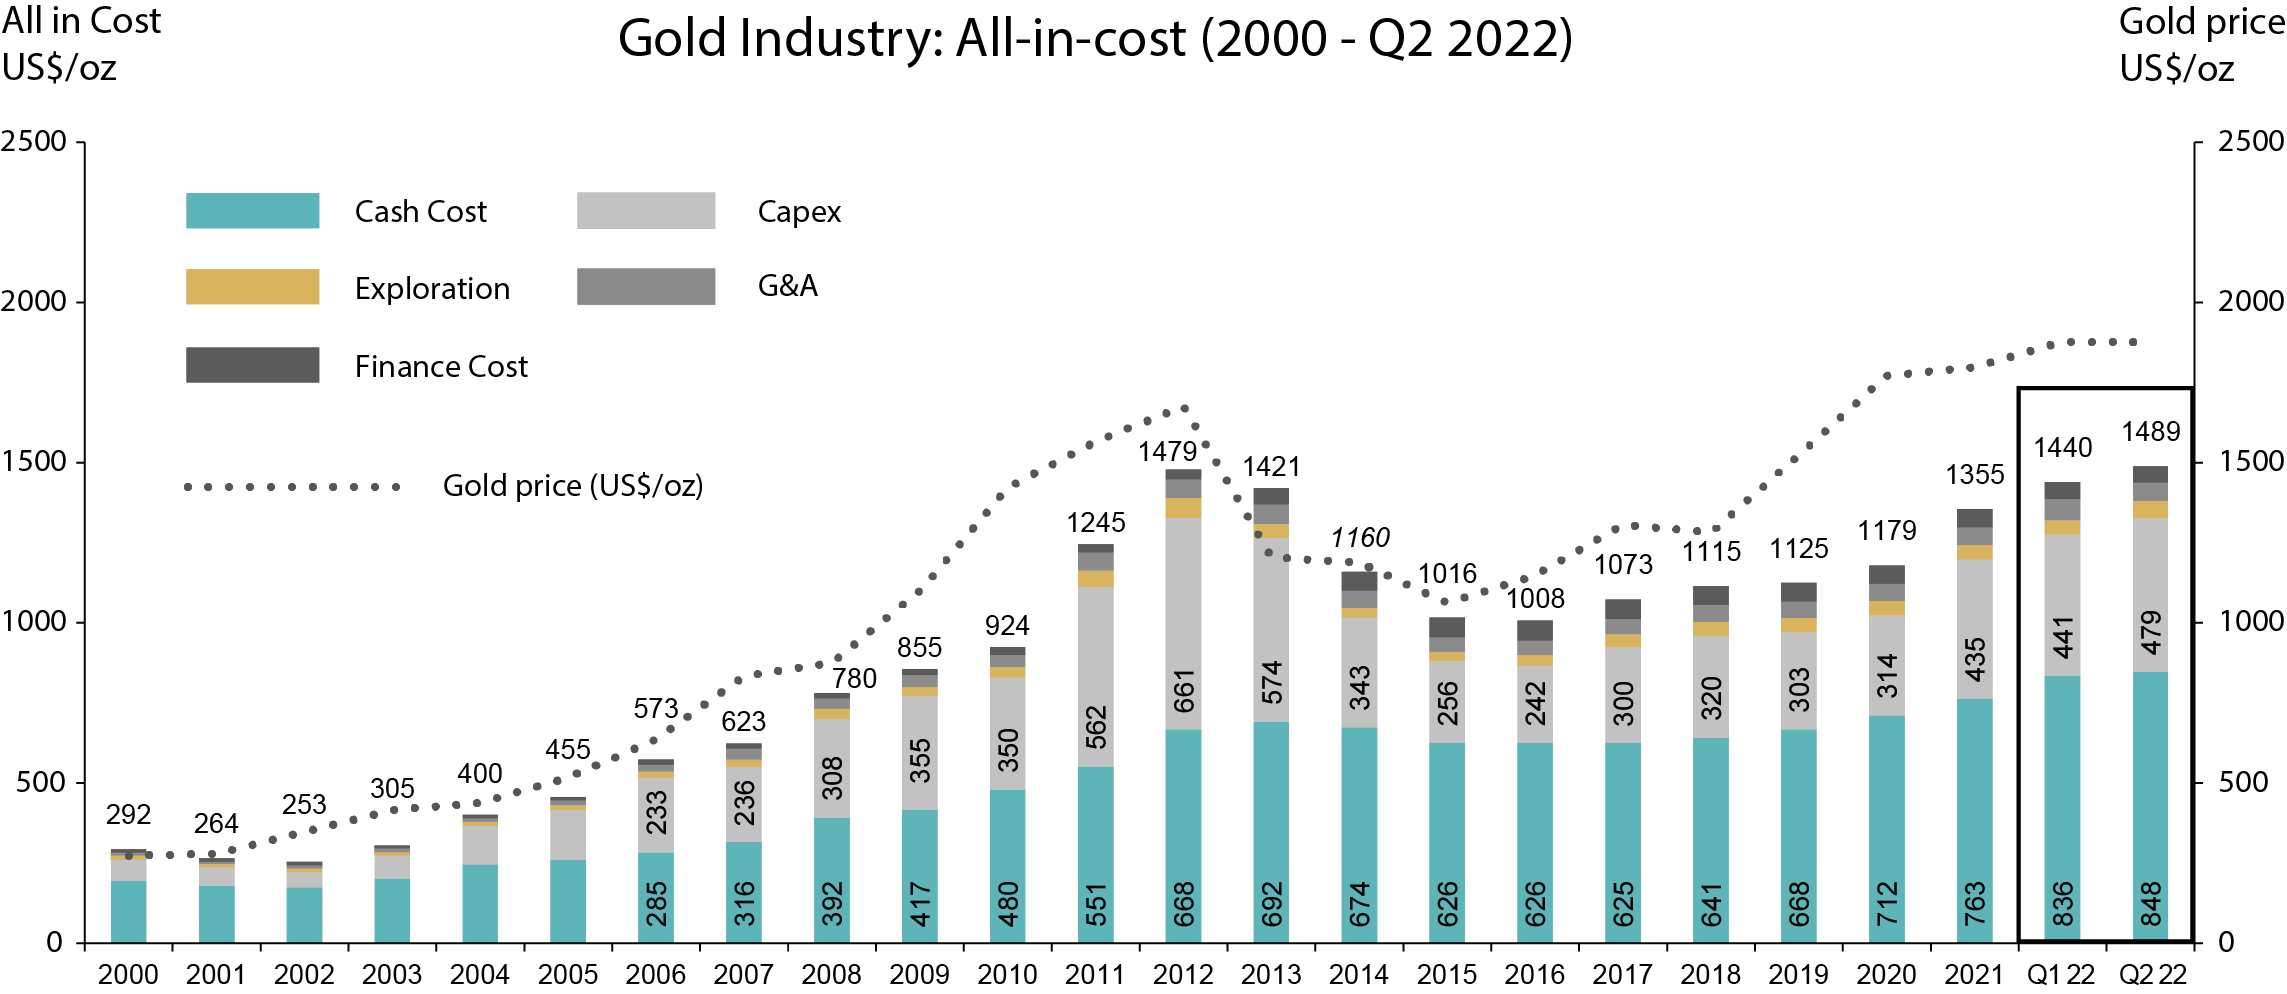
Q2 2022 All in cost (AIC) came in at $ 1490/oz, up 3% versus Q1 2022 despite production picking up by 6%. When compared against Q1 2021, All in cost is now up by 13%, again, against a backdrop of rising production, up 3%.
All in cost development to produce an ounce of gold for the largest global gold producers. Note, the last two bars of the graph are quarterly figures for Q1 and Q2 2022. Source: ERIG, company reports
Labour, which represents close to 50% of producers cost base, is the key driver for the cost increases. Although Covid related labour disruption is behind, operators continue to struggle filling vacancies thereby pushing up labour cost. Consumables like steel, cyanide, lime, explosives and the like collectively represents approximately 25% of cost inputs. Energy inputs remain topical during Russia/Ukraine war but only represents around 15% of cost base for gold producers. Scotia – a Canadian bank – computes around US$ 10/oz cost addition for every US$ 10 increase in price of oil/bbl. With Q3 2022 seeing WTI Oil soften by around 15% (down US$ 16 per barrel at the time of writing), gold miners should see a $ 10/oz relief in their cost inputs in the upcoming reporting season, not a material reduction in overall bills but some help, nonetheless.
Such is the lack of clarity on the capex front, miners have simply stopped giving guidance to the market. With the few remaining brave ones, they have simply increased the guidance ranges with most erring towards the top end. Q2 2022 saw capex increase 9% versus Q1 2021. This increases to 25% when compared to Q4 2020 period when the market started seeing early signs of input inflation.
Of note, Newmont provided updated capital guidance on its growth projects: Tanami Phase 2 saw capex increase of 25%; Ahafo North up by 15% while a key growth project – Yanacocha Sulphides – with a capital bill of $ 2.5 bn did not get board approval.
Q2 2022 net Free Cash Flow (FCF) margins stood at 21% however using spot prices of US$ 1650/oz, this now drops to 10%. FCF and dividend yields for the large gold producers are still healthy at 8-10% and 4-5%, respectively, as per BMO Capital markets while share buy backs are still on the table.
With such rapid net margin compression and costs pressure continuing to remain elusive, perhaps it is time, again, to get back to basics and keep balance sheet health front and centre.
Reserve prices used to calculate economic ounces are still flat at $ 1.200/oz, comfortably below spot prices. With sector leverage at cyclical lows and a new crop of management very wary of M&A, the advisors remain confident gold producers will continue to maintain caution and discipline.
Furthermore, key inputs such as steel, cement and freight charges have seen sharp corrections lately. Forward inflation indicators have also been indicating a softening of price rises. As such, elusive as it continues to be, it seems gold producers have likely seen the worst of cost inflation.
For these reasons, we expect an improved cost trend for gold producers, which should also be reflected in their valuations. Given our expectation of a rising gold price in a volatile geopolitical environment, a recovery in equity prices can be expected in the medium term.
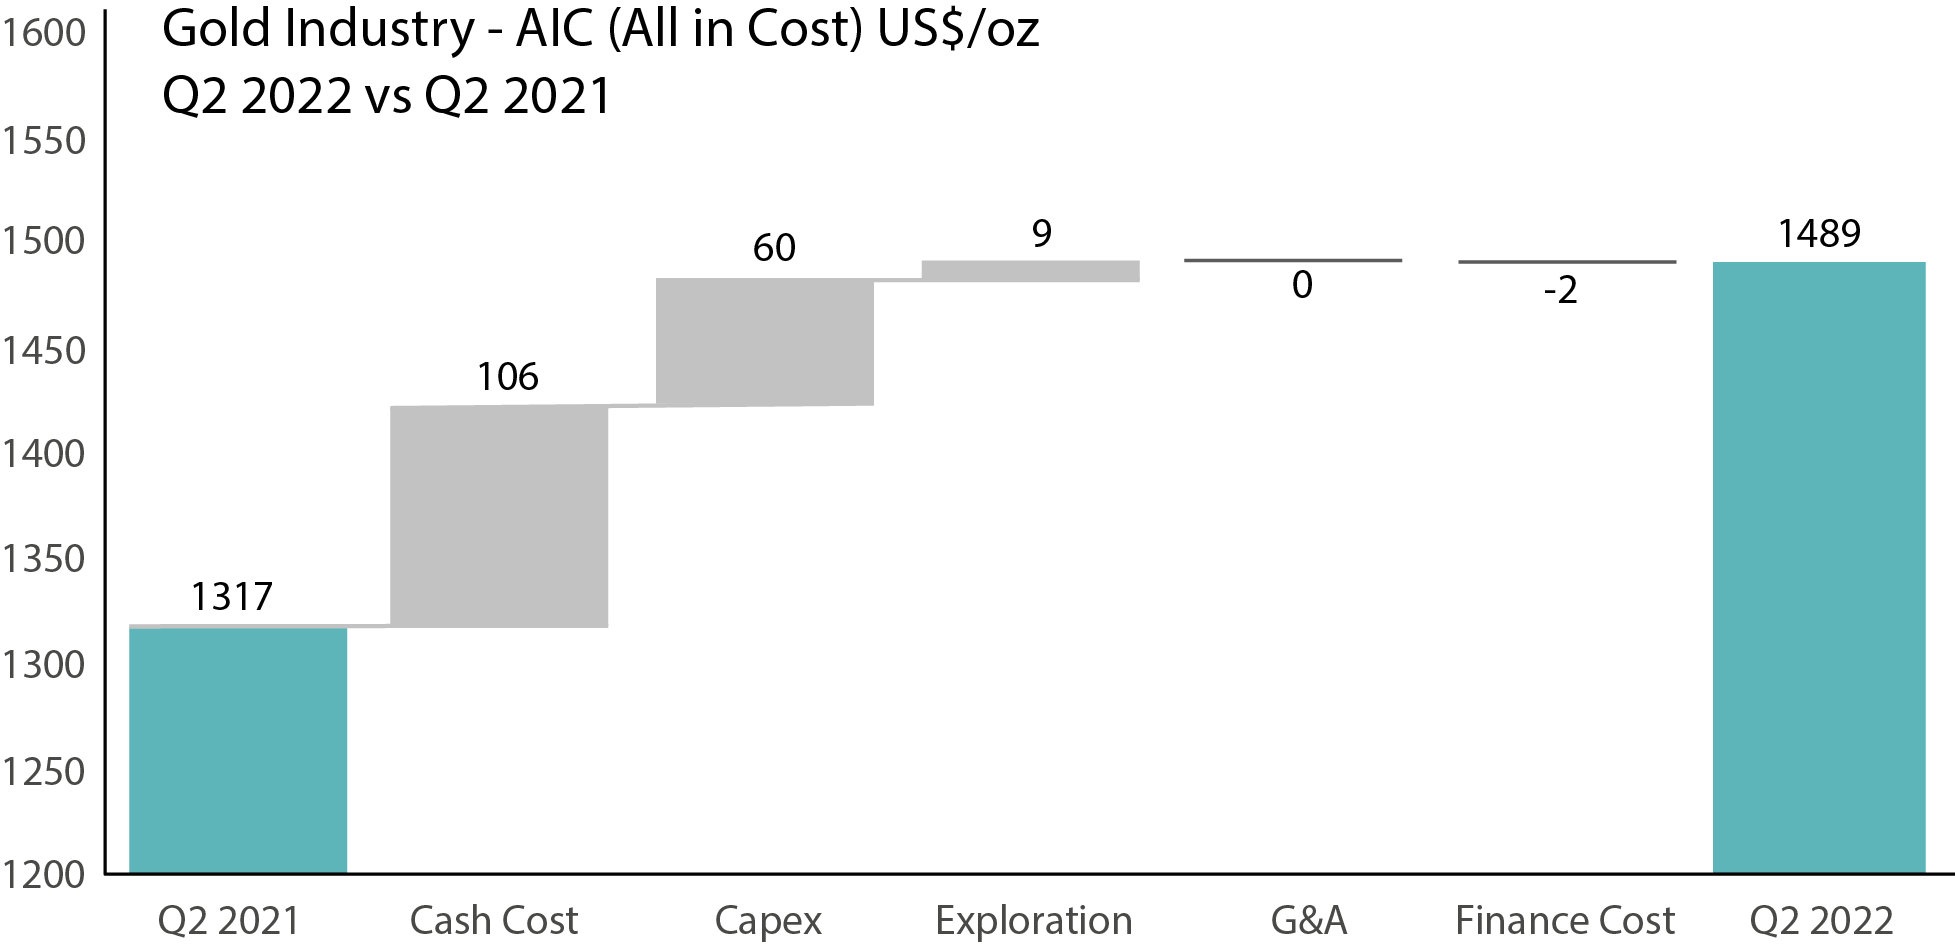
Waterfall chart showing the increase in all-in-cost to produce an ounce of gold from Q2 2021 to Q2 2022. Largest cost increase was seen on the operational side (cash costs) but also for new project builds and expansions (Capex). Source: ERIG, company reports
This website uses cookies so that we can provide you with the best user experience possible. Cookie information is stored in your browser and performs functions such as recognising you when you return to our website and helping our team to understand which sections of the website you find most interesting and useful.
Strictly Necessary Cookie should be enabled at all times so that we can save your preferences for cookie settings.
If you disable this cookie, we will not be able to save your preferences. This means that every time you visit this website you will need to enable or disable cookies again.