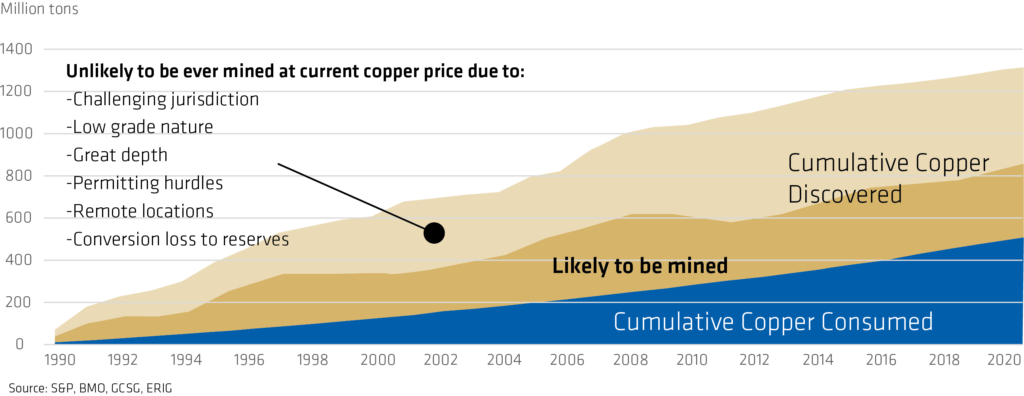
We put together a graph, backed by S&P and GCSG data on world copper consumption, copper discoveries and resulted copper inventories over time. Inventory (brownish colour) has been accumulated since the 90’ies, when large copper porphyry deposits have been discovered, mainly in Latin America, North America and South East Asia. What might seem as a large copper inventory, hosted in global copper deposits, warrants a closer look.
A large volume of this inventory will never be mined at current copper prices. The inventory is either locked in low grade mineralisation (< 0.3% copper per ton of ore), the deposit is located in a challenging political jurisdiction or remote area or located in great depth or classified in a low quality resource category that might face conversion losses when upgrading it with further drilling. The actual inventory that will be suitable for mining with limited available efforts and resources is lower, likely much lower. In our view as low as 50% or even less.
This situation is a large challenge for future copper supply to meet an ever increasing demand, lately also fueled by new application fields which are copper intensive such as offshore wind power generation, electric vehicles or solar power farms with its auxilary power grids.
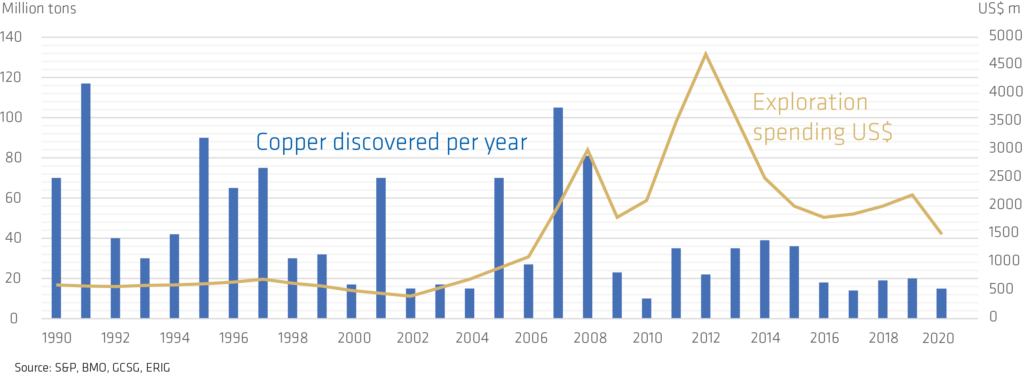
The lower portion of the graph also displays the rate of which large copper deposits have been discovered over the past decades. Large copper discoveries in latin america occured in the early 90’s, but since then discoveries have diminished and are well short of what society is consuming on an annual basis. This lack of discoveries is pronounced despite a strong ramp up in exploration spending during the last commodity super cycle more than a decade ago.
This website uses cookies so that we can provide you with the best user experience possible. Cookie information is stored in your browser and performs functions such as recognising you when you return to our website and helping our team to understand which sections of the website you find most interesting and useful.
Strictly Necessary Cookie should be enabled at all times so that we can save your preferences for cookie settings.
If you disable this cookie, we will not be able to save your preferences. This means that every time you visit this website you will need to enable or disable cookies again.